Downtime Simulation
Downtime Simulation in PetroVR
Facility downtimes are events that reduce the production of the facility by some factor. They are usually the consequence of accidental malfunctions that take place randomly.downtimes" src="Resources/Images/downtime1.png" />
Facility downtimes are not easy to specify because they can happen at any time and with different intensities. The approach adopted by PetroVR has the virtue of reducing all that complexity to a single value that represents an average fraction of the time the facility is completely down. Thus, the result is a continuously distributed downtime which does not model real downtime since it replaces the randomness of sporadic failures with predictable and unreal daily impacts, but serves however the purpose of representing the overall effect of authentic downtimes when considered over long periods.
Unfortunately, this simplification also entails some limitations. This section analyzes some of these limitations in an attempt to make clear how best to use the feature to meet particular needs.
Modeling Downtimes
In order to simulate downtimes, a reduction factor 0 ≤ R ≤ 1 is applied to the production of the facility as shown below:

Note that after applying the downtime penalty, the potential production is reduced by a factor of R. In doing this the excess at the facility is now computed as the sum of the excess ET calculated to honor the capacity plus the amount E' removed by the impact of the downtime:
ET + E' = ET + (X - ET) R = ET (1 - R) + X R
The formula shows that as R runs from 0 to 1 the combined effect of the capacity constraints and the downtime runs from ET to X, meaning that a null impact keeps the full production untouched and that the maximum impact shuts the facility for the duration of the downtime.
Note also that the reduction is not applied to the capacity of the facility as defined in the Capacity Sub-Tab but to the potential production that results from the application of capacity constraints.
A Simple Example
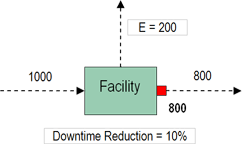
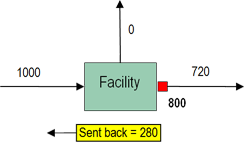
Let us consider now a simple example. We will assume that the maximum amount sent to the facility is 1000, the downtime reduction factor is 10% and the capacity is 800. Initially the facility is regarded as having an excess of 200:

Excess is resolved first, so that the 10% reduction corresponding to downtime is applied to the resulting 800. The actual production of the facility will then be 720.

Downtime Overlapping
When two or more facilities are connected to each other on the same production line, calculating the impact of their combined downtimes poses particular problems.
In some situations, the effect of downtimes is better modeled with an asynchronous approach that applies each downtime consecutively without considering the possibility of an overlapping. In some others, however, there could be an actual overlapping between the downtimes of different facilities; and the overlapping may be partial or total.
PetroVR adopts the latter approach: it assumes that facility downtimes occur simultaneously, so that higher downtime percentages absorb the impact of lower ones, and therefore the lowest potential production encountered in a system of interconnected facilities becomes the potential production of the whole system.
Practical Consequences
Continuously distributed downtimes choke the production all the time.
When a facility has a downtime associated to it, it is by definition constantly choking the system regardless of its capacity, because it is in fact scaling back a percentage of the fluids it would receive otherwise. This causes an excess state, and may trigger the facility's excess policies, as discussed below. See also Excess Policy Tab.
Downtimes do not affect local capacity expansion policies.
This is a direct corollary of the fact that downtimes always choke the production. Since downtimes effectively scale back the production, they could cause the drilling of some wells to be deferred, or the shut-in of others. You always have the possibility to specify a threshold high enough as to compensate this effect. For instance, for a downtime of 10%, the threshold for a defer-drilling or shut-in policy should take that 10% into account. Note however that such compensation may be not enough to cancel the effect. As discussed above, a downtime in one facility has an effect on the production of the facilities up- and downstream. Therefore, a local compensation would not avoid other facilities to apply their own defer-drilling or shut-in policies.
